I needed a data generator that I could use for my data engineering Home Lab project and this is my attemp to fulfill that need.
The idea is simple:
Generate dozens or even hundreds of data streams containing simulated CPU temperature and load metrics.
- Each simulated CPU produces one independent data stream
- Each stream continuously emits:
- CPU temperature metrics
- CPU load metrics
- All streams are published to a Mosquitto MQTT broker running in a Docker container
You can check the full project on my Github
https://github.com/FelosRG/cpu-heat-metrics-generator
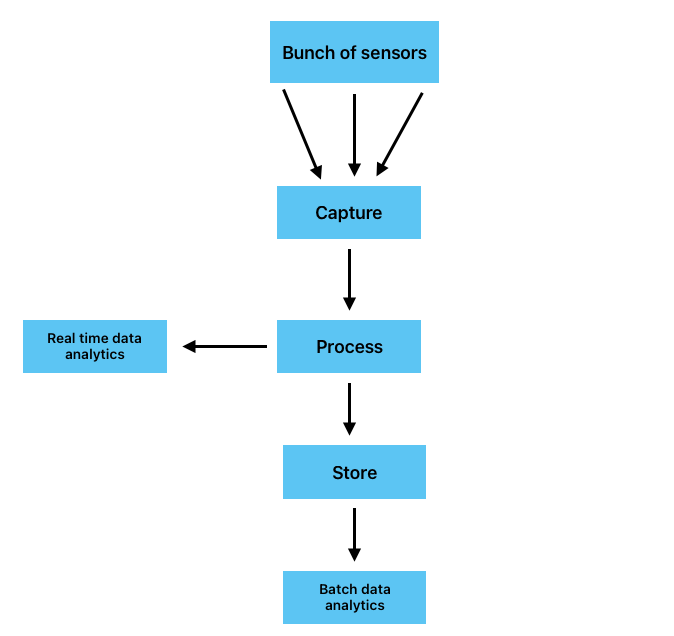
What is an MQTT broker and why use one?
An MQTT broker is a software tool used to collect large amounts of data from different sources in a single place. It is especially commonly used for sensor and IoT data. Mosquitto is one popular implementation of an MQTT broker.
An MQTT Broker is mainly use because it helps separate (or decouple) data producers from data consumers. This means that for each data consumer, I don’t have to worry about how the connection will be established and more importantly, data producers are not saturated with excessive requests. They only have to publish their data once, in a single place: the MQTT broker.
Project Components
The project consists of four components, each running in its own Docker container and orchestrated using Docker Compose:
- Simulation Worker
Responsible for running the simulation and generated the temperature values. - Redis Database
Stores CPU physical parameters as well as others simulation configuration. - Web App
Provides a real time view of simulation telemetry and allows to adjust selected simulation parameters. - Mosquitto MQTT
Collects all generated data and makes them available for further distribution.
Results
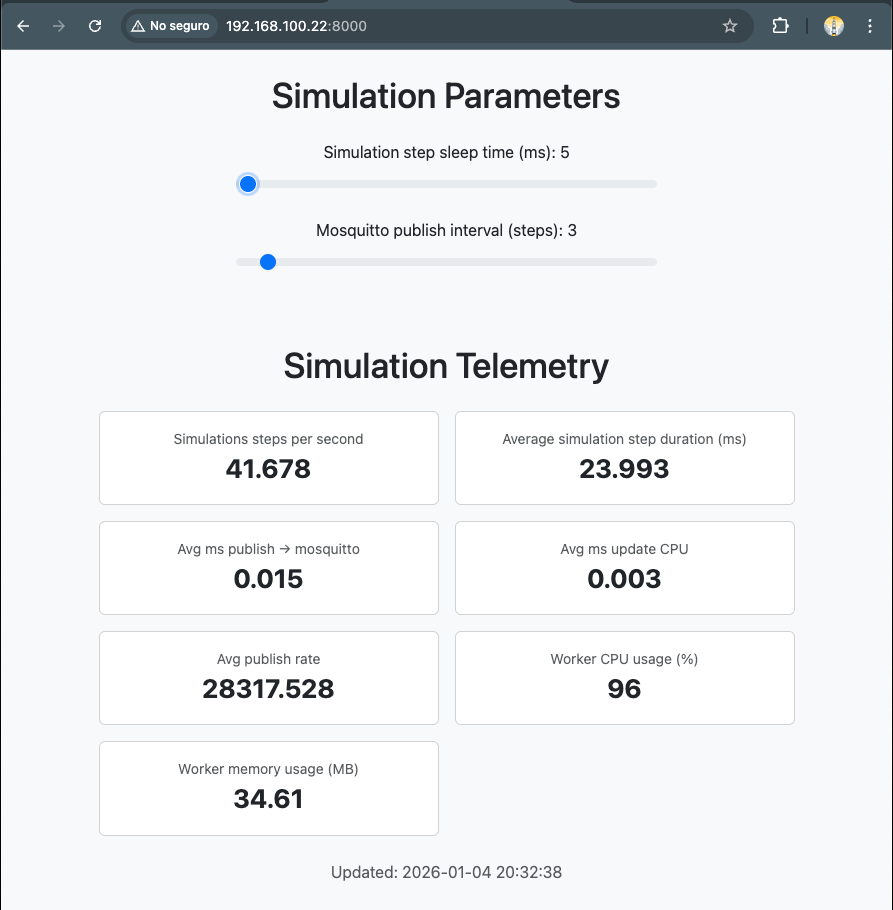
Using a basic Mini PC with an Intel N150 chip, I was able to simulate 2,000 CPUs, each streaming its temperature values to the MQTT broker (Mosquitto). At this scale, I managed to run the simulation at a rate of 40 steps per second, sending approximately 28,000 messages per second to the MQTT broker.
The Live Monitor Web Application provides real time visibility into the simulation telemetry and allows you to adjust selected simulation parameters.
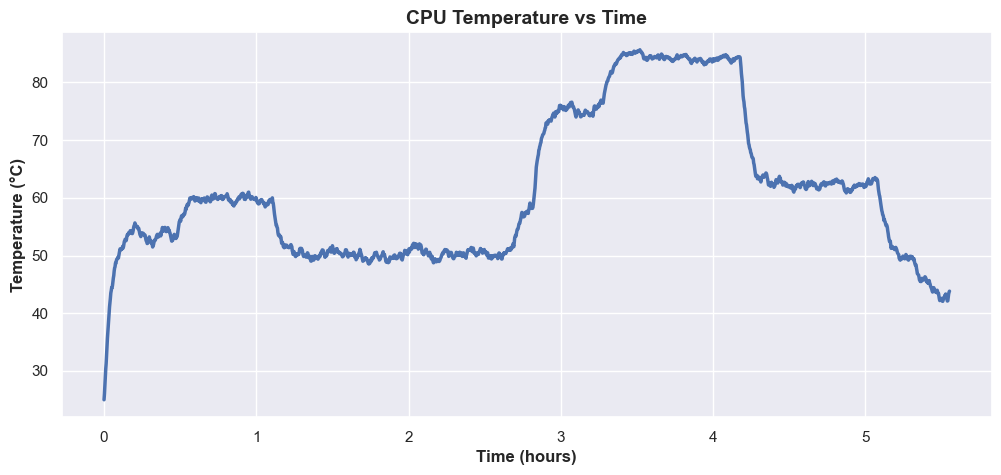
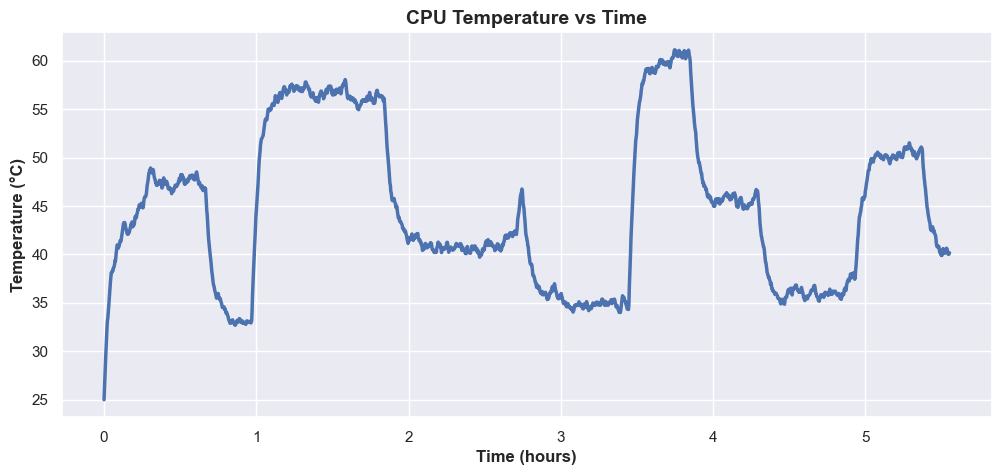
The following plots illustrate how CPU temperature values evolve over time. The examples below show two simulations running continuously for six hours.
If you are interested in the mathematical model behind the simulation, the next section explains how equation used in the simulaton was derived.
Heat Simulation Details
For the physical heat simulation I used the principle of conservation of energy and with the heat transfer equation. The derivation is as follows.
From the equation of conservation of energy we know that the rate of change of energy in a system is call power (P)
The power acting on a system is just the power entering the system () minus the power leaving the sytem ()
Since we want to simulate the thermal output of a CPU we can write as a function of time
Remebering that thermal energy can be described as temperature (T) multiplied by a constant called thermal capacitance () . Using this relationship we can write
And substituting into the equation
The thermal energy leaving the system is proportional to the temperature difference between the system and the ambient temperature. Based on this relationship, the power leaving the system () can be modeled as a heat flow term as shown below
This leads to the final equation, we now just need to convert it in a numerical form that can be run by a computer
The next step is to convert it into a numerical form suitable for execution on a computer.
And after simplification, this is the equation used to compute the temperature evolution in the simulation.
Typical (thermal resistance) values are around 0.1 – 0.420 for a regular CPU with its fan turn on. (Wikipedia)
And for (thermal capacitance) in the simulation I used values around 200